Thinking about trading your Queens apartment for more space on Long Island, or deciding if city convenience still wins? It is a real question for many New Yorkers who want a yard, a driveway, or a quieter street without losing access to work and daily amenities. In this guide, you will see how Suffolk County compares to Queens on space, pricing, commute time, and taxes so you can choose with confidence. You will also get a quick checklist to make the numbers real for your lifestyle. Let’s dive in.
Suffolk vs Queens at a glance
Queens is an urban borough with far more multi-unit buildings and higher density, while Suffolk County is predominantly suburban with single-family homes. That difference shapes your daily life, from parking to private outdoor space. According to Census Reporter, Queens is much denser than Suffolk and has a longer median commute overall for county residents, which tracks with its city environment and transit-first travel patterns. You can review Queens’ profile for context on density and commute trends in the borough in the Census Reporter summary.
Household size is another helpful proxy for space. Suffolk households average around 3 people, compared with about 2.6 in Queens, which aligns with more 3 bedroom or larger single-family homes on Long Island. See the county profile for Suffolk in Census Reporter for supporting household measures.
Space and home types
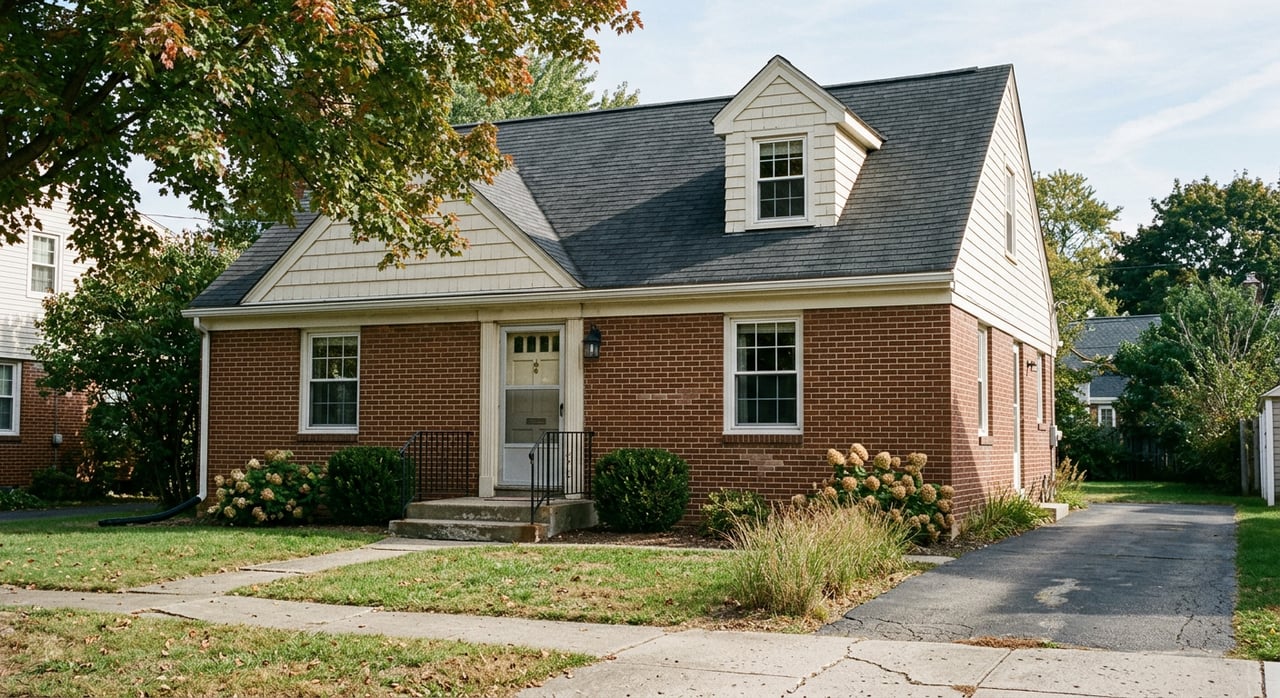
If you want a traditional single-family home with a larger yard and a driveway, Suffolk County offers many options. The county’s housing stock is heavily weighted to 1 unit detached homes, which is the classic suburban pattern. For a broad snapshot of that tilt toward single-family, see Suffolk’s housing statistics in Infoplease.
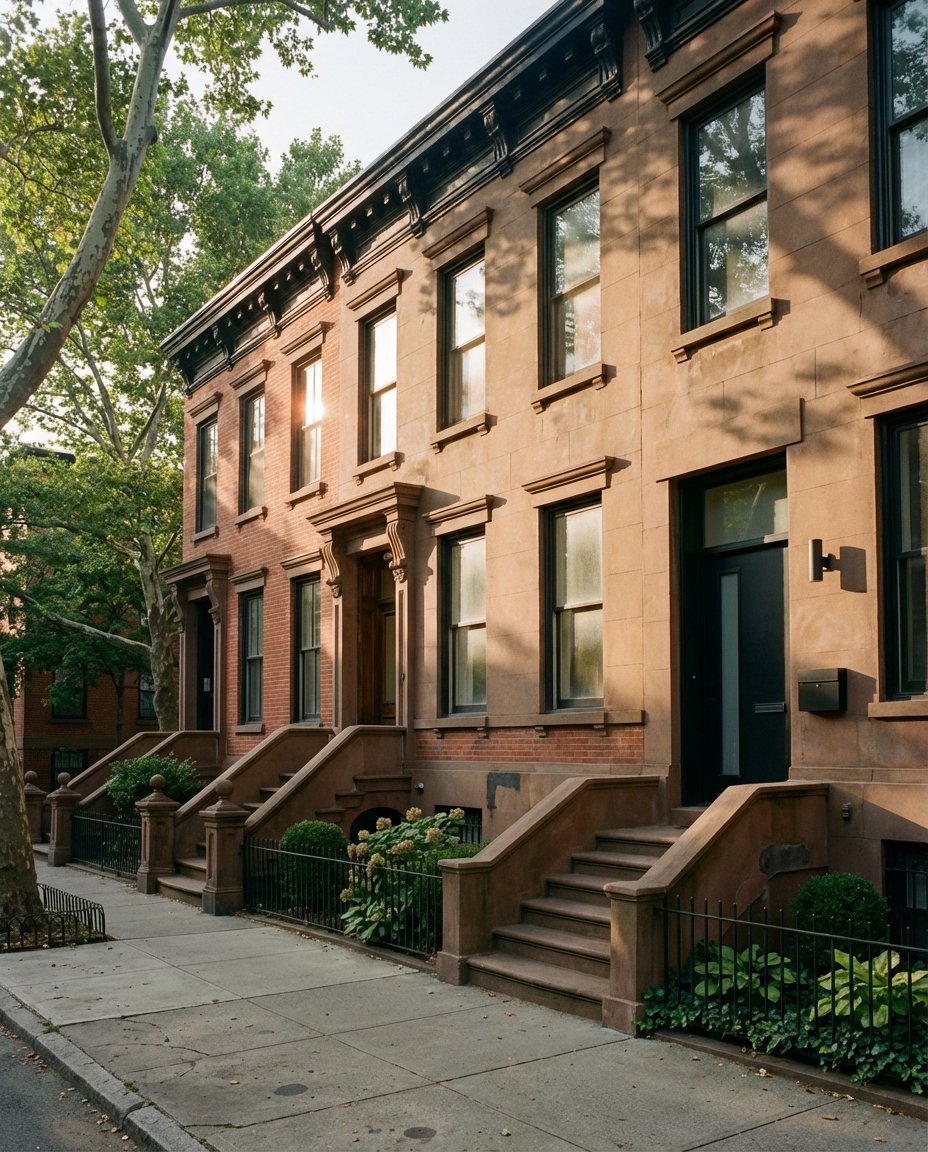
Queens includes a wide mix: co-ops and condos in multi-unit buildings, plus 1 to 3 family row or attached homes in many neighborhoods. NYC Planning’s ACS-based summary highlights the borough’s substantial multi-unit component, which tends to mean smaller private lots and more shared building amenities in many areas. You can scan the city’s housing composition overview in the NYC Planning brief.
Private outdoor space also tends to differ. In Queens, many attached homes sit on lots commonly around 20 by 100 feet, which is about 2,000 square feet of land. In Suffolk, local zoning districts often start with minimum lot sizes in the thousands of square feet, frequently in the 7,500 to 20,000 plus square foot range depending on the town and zone. For a practical example of how towns regulate minimum lot area, see a staff report referencing residential standards in Suffolk County Planning Commission documents.
Prices and market pace
Here is how price levels compare, using two standard measures and dated for clarity:
- As of Feb 2026 the Zillow Home Value Index shows typical values of about $739,475 in Queens and $688,224 in Suffolk. These are current market signals and help you gauge momentum in each area.
- The American Community Survey’s 2024 median owner-occupied values provide longer-run baselines of about $720,300 in Queens and $626,300 in Suffolk. You can review Queens’ ACS profile here and Suffolk’s here.
Market speed also differs. In early 2026, Suffolk showed a shorter median days-to-pending, around 43 days, with more sales closing over list price in hot submarkets. Queens showed a longer median days-to-pending, around 71 days, with fewer over-list outcomes. These are county-level snapshots that vary by town, neighborhood, and property type, so plan to refresh local numbers before you make offers.
Commute and daily rhythm
At the county level, commutes tend to be longer for Queens residents than for Suffolk residents when you look across all modes and destinations. Census Reporter lists Queens’ median travel time to work at about 43.8 minutes and Suffolk at about 31.3 minutes, though those medians include many different trip types. See the Queens profile for context.
If you commute to Manhattan, the Long Island Rail Road is the backbone from Suffolk. Typical peak travel times vary by branch and station. Regional analysis indicates best-case times to Midtown are roughly 55 to 61 minutes from the Huntington and Babylon branches and about 60 to 80 minutes from the Ronkonkoma branch. Door to door, many central or western Suffolk commuters should expect about 50 to 75 minutes including station access, parking, and transfers. You can review branch-level patterns in this RPA LIRR report and check current schedules in the MTA resources.
Day to day, Queens offers greater transit access and walkability in many neighborhoods, while Suffolk is more car-focused with park-and-ride routines. That shifts your errands, childcare timing, and how you plan your workday.
Taxes and carrying costs
Property taxes are a major swing factor. Based on Tax Foundation county-level effective rates, Suffolk’s effective property-tax rate is about 1.85%, compared with about 0.88% in Queens (2023). Using Feb 2026 typical values as a simple illustration:
- Queens example: 0.88% of $739,475 is about $6,500 per year in property taxes.
- Suffolk example: 1.85% of $688,224 is about $12,700 per year in property taxes.
These are rough estimates to help you budget. Verify the actual bill for any property you are considering. You can review the effective-rate comparison in the Tax Foundation county table.
Monthly costs also differ by property type. In Queens, many buyers choose co-ops or condos and pay monthly maintenance or HOA fees. In some co-ops, those fees include property taxes and certain utilities. In Suffolk, single-family ownership shifts more maintenance and insurance directly to you, including items like yard care, roof upkeep, septic or sewer fees, and snow removal. Co-op purchases also commonly involve board approval and stricter financial documentation, while condos and single-family homes follow different financing and closing workflows.
Who should buy where
Buying in Suffolk may fit you if:
- You want a larger private yard, a driveway or garage, and more interior space.
- You prefer a quieter, suburban setting with a single-family neighborhood feel.
- You can accept a longer Manhattan commute and a car-centered routine.
- You are comfortable with higher annual property-tax bills at similar price points.
Staying in Queens may fit you if:
- You value short walks to transit, restaurants, and daily services.
- You like multi-unit living, building amenities, or lower-maintenance ownership.
- Your commute benefits from subway access or shorter LIRR rides.
- You want a lower effective property-tax rate in many situations.
If you are splitting the difference on commute time and space, Nassau County often functions as a middle ground. Your exact trade-offs will depend on the town, station access, and property type you choose.
How to decide: quick checklist
- Budget reality check: Compare county medians to your target neighborhoods and run a monthly estimate for mortgage, taxes, insurance, and any HOA or co-op maintenance. Use the effective tax-rate signal from the Tax Foundation and confirm actual tax bills on a specific listing.
- Space and yard needs: List your must-haves, like 3 bedrooms, a garage, and a yard size. Suffolk’s zoning often supports larger lots; review local zoning or planning documents like the Suffolk Planning Commission report to understand typical minimums in your target town.
- Commute tolerance: Add 15 to 30 minutes to posted LIRR schedules for door-to-door estimates. Cross-check travel ranges in the RPA LIRR analysis and test a live run using MTA tools.
- Ownership type: Decide if you prefer single-family control of maintenance or the simplicity of condo or co-op living. Factor in maintenance or HOA fees where applicable.
- Resale horizon: If you plan to resell within a few years, compare local days on market and buyer pools for your exact submarket and property type.
Final thoughts and next steps
Both Suffolk County and Queens can be smart moves. Suffolk usually buys you more private space and a single-family lifestyle, with higher annual property taxes and longer Manhattan commutes. Queens usually delivers stronger transit access and lower effective property-tax rates, with more multi-unit options and smaller private lots. The right choice comes down to your space needs, commute tolerance, and long-term budget.
If you want a side-by-side plan tailored to your commute, must-haves, and budget, we can help you model both paths. With construction-informed guidance for single-family homes and deep experience in condo and co-op purchases, our family-led team makes the trade-offs clear so you can move forward with confidence. Ready to compare neighborhoods, test a commute, or request a valuation? Connect with The Castle Team at Keller Williams to get started.
FAQs
What are typical home values in Suffolk County vs Queens in 2026?
- As of Feb 2026, Zillow’s index shows about $688,224 in Suffolk and $739,475 in Queens, while ACS 2024 owner-occupied medians are about $626,300 in Suffolk and $720,300 in Queens.
How do property taxes compare between Suffolk County and Queens?
- Based on 2023 effective rates, Suffolk is about 1.85 percent and Queens about 0.88 percent; at 2026 typical values that is roughly $12,700 per year in Suffolk vs about $6,500 in Queens.
What is a realistic Suffolk-to-Manhattan LIRR commute time?
- Plan for about 50 to 75 minutes door to door for many central or western Suffolk stations, depending on branch, schedule, station access, and transfers.
How does space differ between Suffolk County and Queens homes?
- Suffolk is dominated by single-family homes on larger lots, while Queens offers more multi-unit buildings and attached homes, which usually means smaller private lots but greater building amenities.
What ongoing costs differ between a Queens co-op and a Suffolk single-family home?
- Co-op buyers often pay monthly maintenance that can include taxes and some utilities, while single-family owners handle their own taxes, insurance, and maintenance items like yard care, roof, and snow removal.